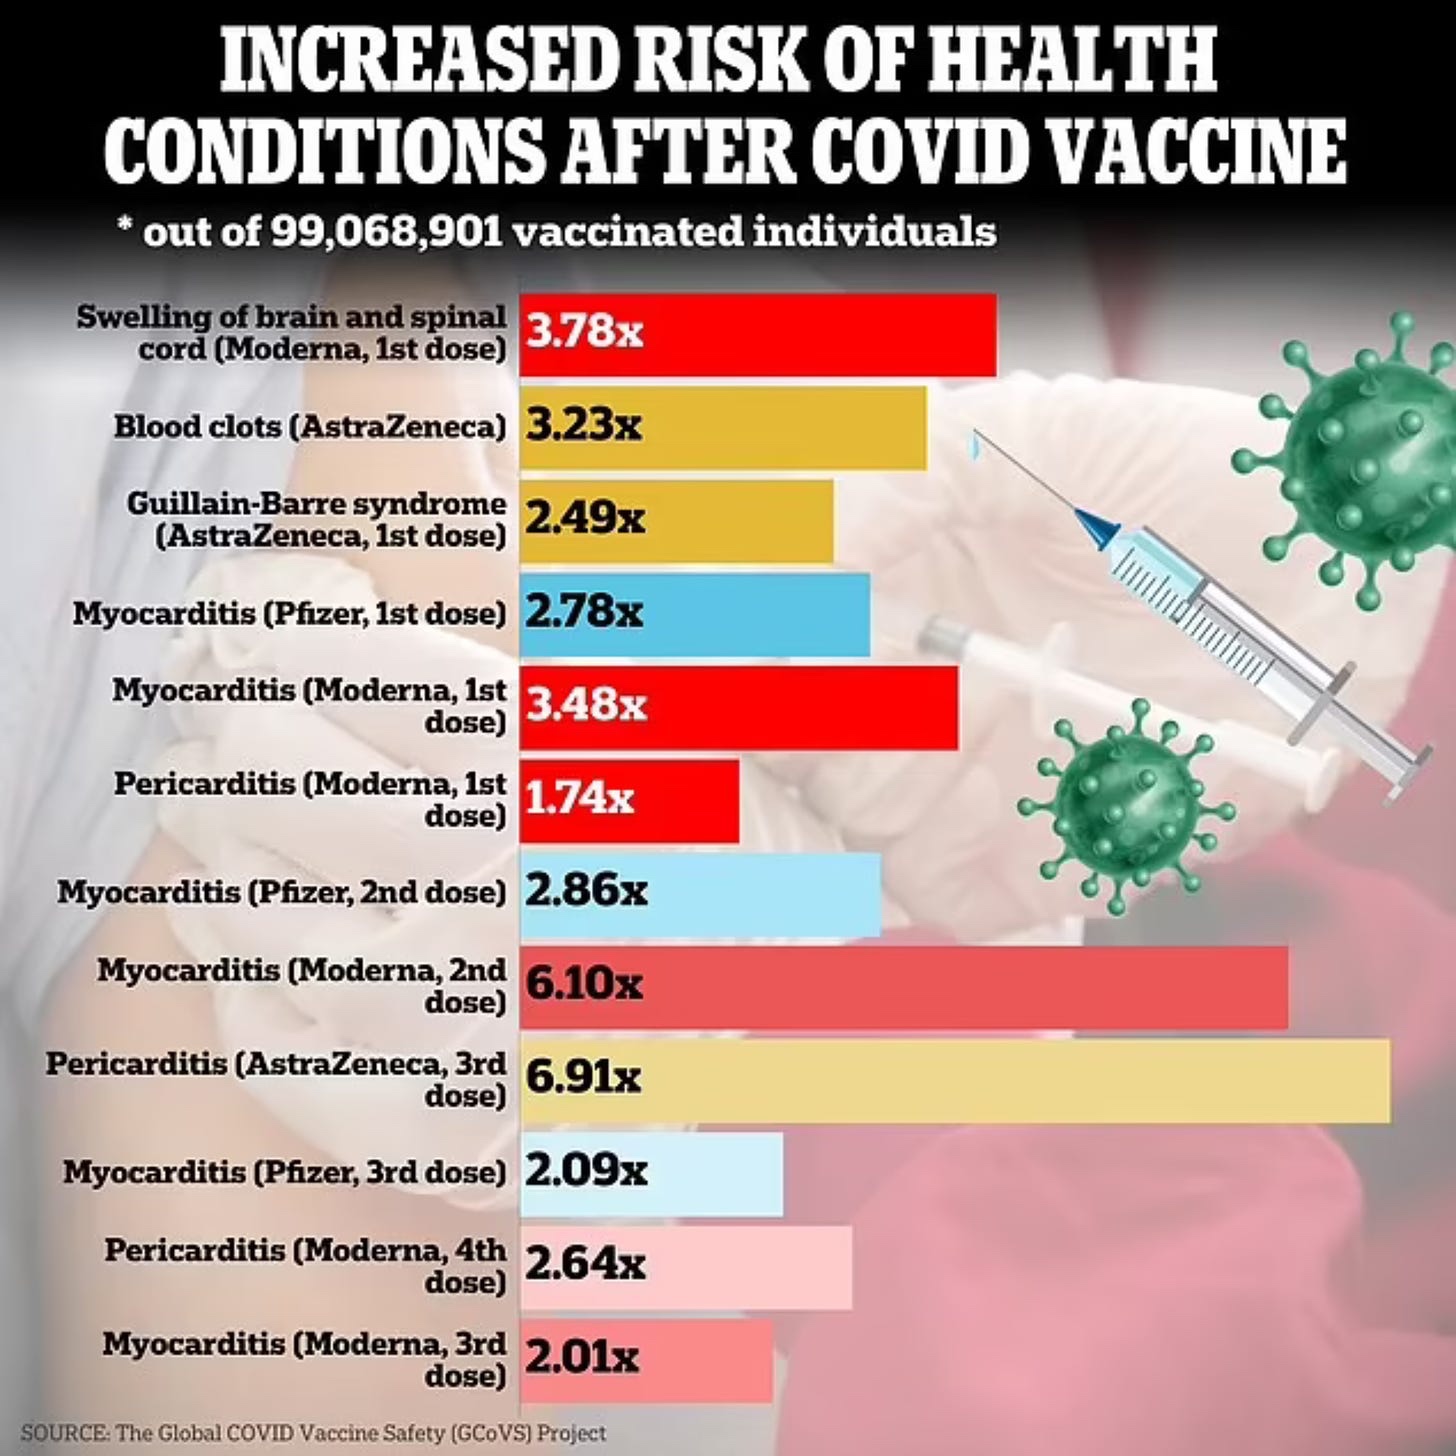
Evidence update: The research behind this graphic identified important safety findings, but it did not validate an unspecified collection of conspiracy claims. Its reported cohort contained approximately 99 million vaccinated people, not 96 million. The useful questions are which outcomes increased, after which products and doses, how large the absolute risks were, and how confidently vaccination explains the findings.

Original infographic retained for context. Its source is the Global COVID Vaccine Safety project study by Faksova and colleagues; the original post did not supply a separate creator credit or source hyperlink.
What the comparison measured
Faksova and colleagues examined 13 selected health outcomes across ten sites in eight countries. They compared events recorded within 42 days of vaccination with expected numbers derived from earlier healthcare data. This observed-versus-expected design can detect unusual patterns. It does not provide the same protection against confounding as a randomised trial or a carefully chosen contemporary comparison.
Historical rates may differ from later rates for reasons other than vaccination. Infection waves, use of healthcare services and diagnostic recording are among the possibilities investigators need to consider. A very large sample helps detect uncommon events; it cannot automatically remove these sources of bias. Nor should the total cohort size be used as the denominator for every product-and-dose result.
Multipliers are not the chance of being harmed
The image highlights relative increases. A ratio of three means three times the expected frequency in the comparison being made. It does not mean a 3% chance of the outcome. As a purely hypothetical example, an increase from one to three events per 100,000 people would be a tripling, with an absolute difference of two per 100,000. The actual baseline, follow-up period and uncertainty must accompany a real estimate.
Confidence intervals also matter. A result based on few cases may have a wide range of plausible values even in a study containing millions of people overall. A graphic that omits that range can create more certainty than the analysis supports.
Follow-up changes the interpretation
The analysis also reinforced previously recognised safety signals for Guillain–Barré syndrome and cerebral venous sinus thrombosis after a first AstraZeneca dose. These product-specific findings should be acknowledged without treating every monitored diagnosis as vaccine-caused.
The multinational research reinforced known safety signals and proposed others for investigation. One example involved ADEM, an inflammatory neurological disorder. A separate Australian self-controlled analysis using records covering 6.7 million people found associations between AstraZeneca vaccination and ADEM or transverse myelitis, but found neither association with mRNA vaccines. Its estimated absolute associated risks were approximately 0.78 and 1.82 cases per million doses respectively. These findings show why a potential signal needs further, product-specific examination.
Rare serious harms still matter to affected people and to clinical decisions. At the same time, a safety study of selected outcomes does not, by itself, calculate all benefits and harms of a vaccination programme. The responsible conclusion is to acknowledge supported risks, investigate uncertain ones and communicate their scale. Neither the original headline’s claim of vindication nor blanket reassurance can substitute for that work.
References
- Faksova et al., multinational cohort study of 99 million vaccinated individuals (2024)
- Morgan et al., Australian self-controlled analysis of ADEM and transverse myelitis (2024)
