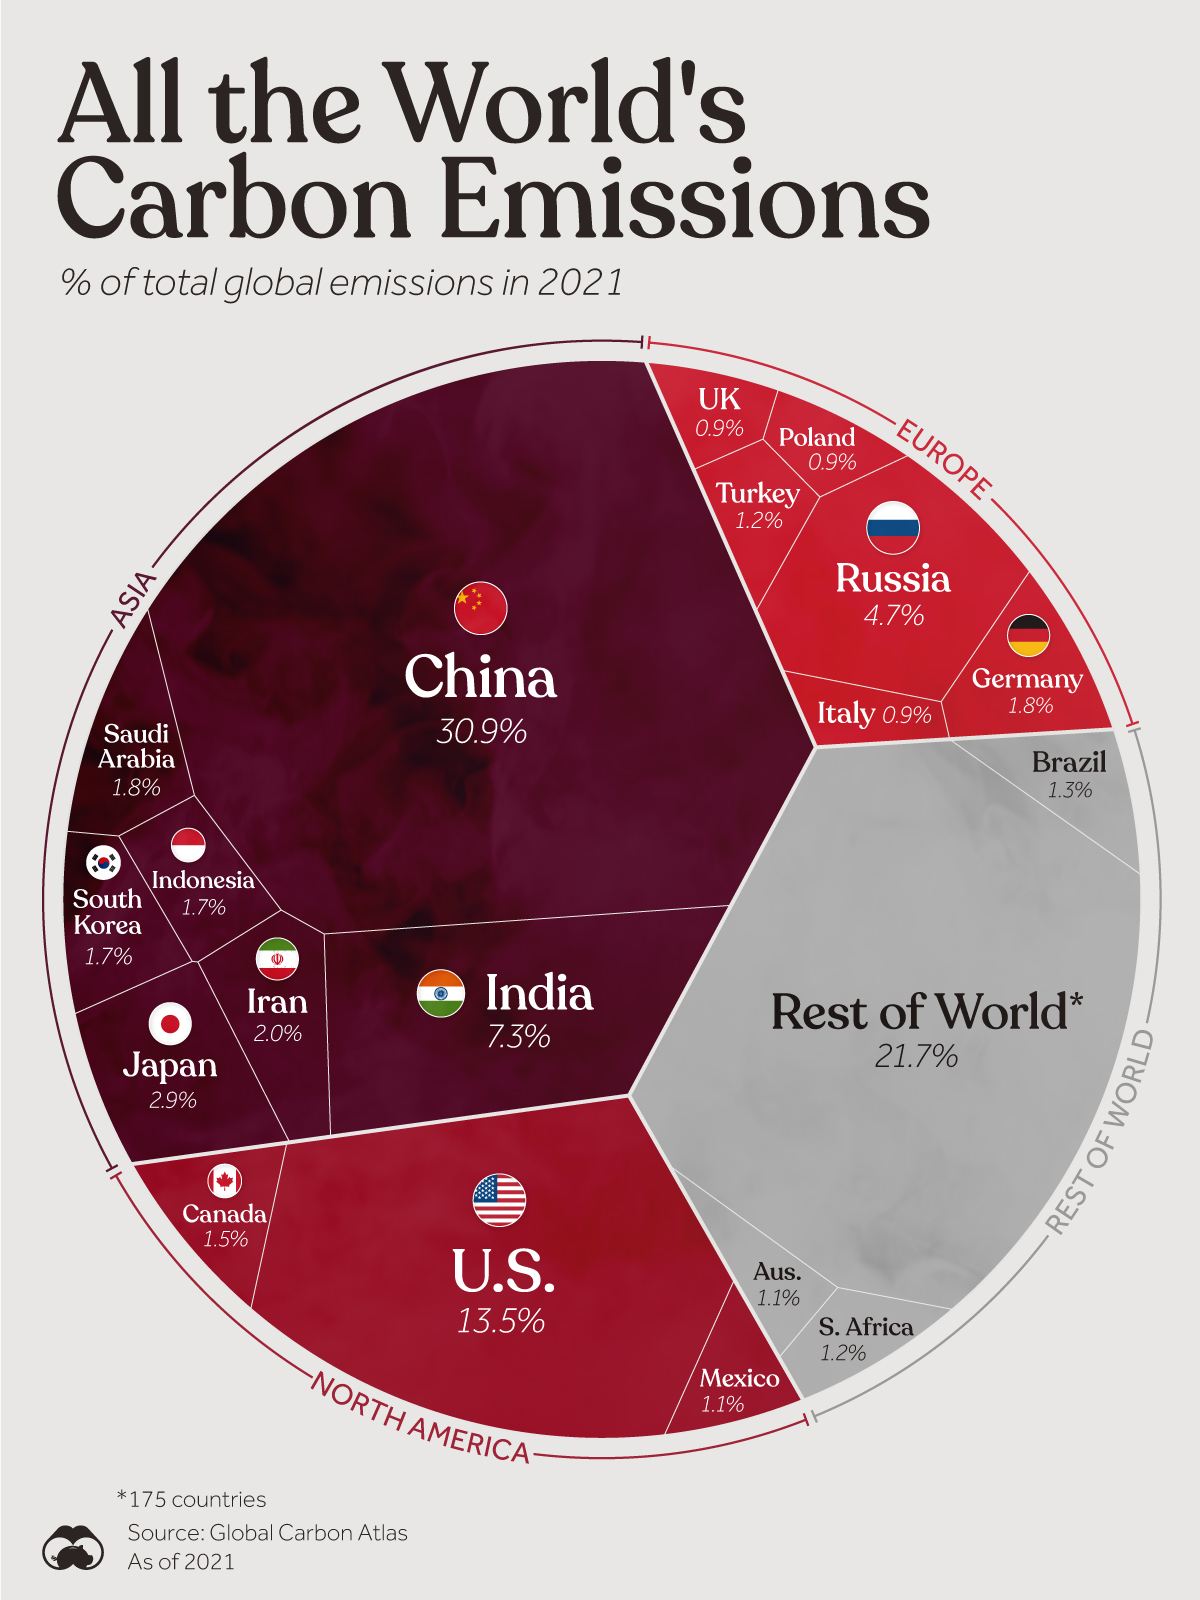
The arithmetic in the original headline does not measure what an individual saves by changing a car or a diet. Dividing a country’s share of global emissions by its population gives an average share per person. It cannot tell us the reduction caused by a particular decision.
The original chart and headline use different dates
The accompanying graphic labels itself as a breakdown of global carbon emissions in 2021 and attributes its data to the Global Carbon Atlas. It shows India at 7.3%. The original headline instead refers to population in 2023. Combining figures from different years already weakens a claim of precision.
Population estimates also depend on the dataset and revision. The United Nations’ 2024 population revision puts India’s mid-2023 population at about 1.44 billion. The exact population figure is less important here than the category error: a national average is not a calculation of avoided emissions.
What an emissions comparison needs
To estimate a change, compare a baseline with an alternative over the same period. For a vehicle, that means looking at manufacturing, fuel or electricity supply, efficiency and distance travelled. A person who drives very little will have a different result from someone who drives frequently, even if they live in the same country.
For food, specify which foods are being replaced, in what quantities, and which emissions are counted. A fossil-carbon chart alone does not capture every greenhouse gas relevant to agriculture. “Eating less meat” is too imprecise to produce one universal percentage.
National accounts also answer different questions. Territorial emissions record what is released within a country’s borders; consumption-based estimates adjust for emissions associated with traded goods. Neither automatically assigns every resident an identical personal footprint.
Small shares can add up
No individual’s percentage of the world total will be large. That mathematical fact applies to almost any shared problem and does not demonstrate that a reduction is zero. Equally, personal choices alone cannot replace changes in electricity generation, transport systems, industry or public policy.
The useful question is which measures achieve meaningful reductions, at what cost and under what conditions. A tonnage saved is a more informative starting point than a tiny fraction constructed from a national total. The original chart can illustrate the distribution of emissions in its stated year; it cannot support the original headline’s precise verdict on an individual action.
Original media
Original 2021 emissions graphic preserved, including its Global Carbon Atlas attribution. Its percentages describe the chart’s stated year and scope, not an individual’s potential emissions savings.

References
- United Nations: World Population Prospects 2024, release note on revisions
- Global Carbon Budget 2024: Scientific assessment and national emissions accounts
- IEA: EV Life Cycle Assessment Calculator
